
Expectations
Before we go into testing and benchmarks, I want to spend a moment to touch on load types as it’s very relevant to the boost frequencies and setting expectations.
Creative workloads
Creative workloads like rendering animations, transcoding/encoding video, etc tend to utilise all available cores. Sustained load of this type will also lead to high CPU temperatures as the processor has to operate with all cores at full tilt hitting TDP limits with little or no opportunity for the thermals to recover with idle time. The all-core boost frequencies apply to these workloads – the whole CPU has to cruise along at a lower speed than single, double or triple core utilisation profiles to keep heat and power under control. Creative / Multi core workloads should run hotter, use more/all cores but the i9-10900K should demonstrate a commanding lead over the i5-10600K because the latter has 40% less available cores to do the same task.
Gaming workloads
Games have various levels of multi-core optimisation but typically the utilisation regularly drops to single or double cores when loading levels or even playing through. At busy times when there was a lot of players or physics/destruction occurring, the active core count will usually spike but then drop again. The load is far more variable and erratic than a creative workload. The more sporadic workload invites single or double core scenarios with higher speeds per core. This pattern can allow the CPU to recover thermally which leads to the 5.3GHz single core Thermal Velocity Boost scenario of the i9-10900K.
In single-threaded tasks, the i5-10600K should be much closer to the i9-10900K because the i9 doesn’t have as much of an advantage in boost frequency (roughly 10%) as it does in core count.
Stock Intel settings Vs MultiCore Enhancement
If you buy an Intel Z490 board, you will almost certainly have the vendor MultiCore Enhancement. I’ve tested with both MCE enabled and with Intel stock limits enforced.
Stock settings – Intel® Limits enforced
Where you just see the processor model number in the graphs it means that we enforced the specification and ran the CPUs with their power limits per the Intel® spec and didn’t apply any ASUS optimisations or overclocks. This should be the worst-case scenario for the CPU as there aren’t any enhancements in place by the motherboard manufacturer. When testing the 9900K, we saw that both ASRock and ASUS Z390 motherboards used in that testing applied some adjustments that improved performance out of the box if you left everything on ‘auto’. This isn’t a bad thing, but it’s worth having a baseline for reference as different motherboards may give the CPU a nudge to various extents.
MultiCore Enhancement (MCE)
Technically this is overclocking. The ASUS optimised defaults can make a difference to how the CPU behaves thermally and deliver improved (optimised) performance. To be clear, this is not the AI Optimised Overclocking function that ASUS has on the MAXIMUS XII. Enabling the MCE will disable the power limits and will result in higher load temperatures. Although this is the configuration I would run personally, it’s potentially unfair on Intel when looking at power draw and thermal performance – so I’ve differentiated the results on the graphs to show stock and potential results.
Testing approach
We don’t have 3rd Generation AMD CPUs on hand at the moment but I plan to compare them to the i5-10600K and i9-10900K at a later date. The benchmarks and testing experience is primarily aimed at showing what to expect as a potential owner of either the i5-10600K or the i9-10900K.
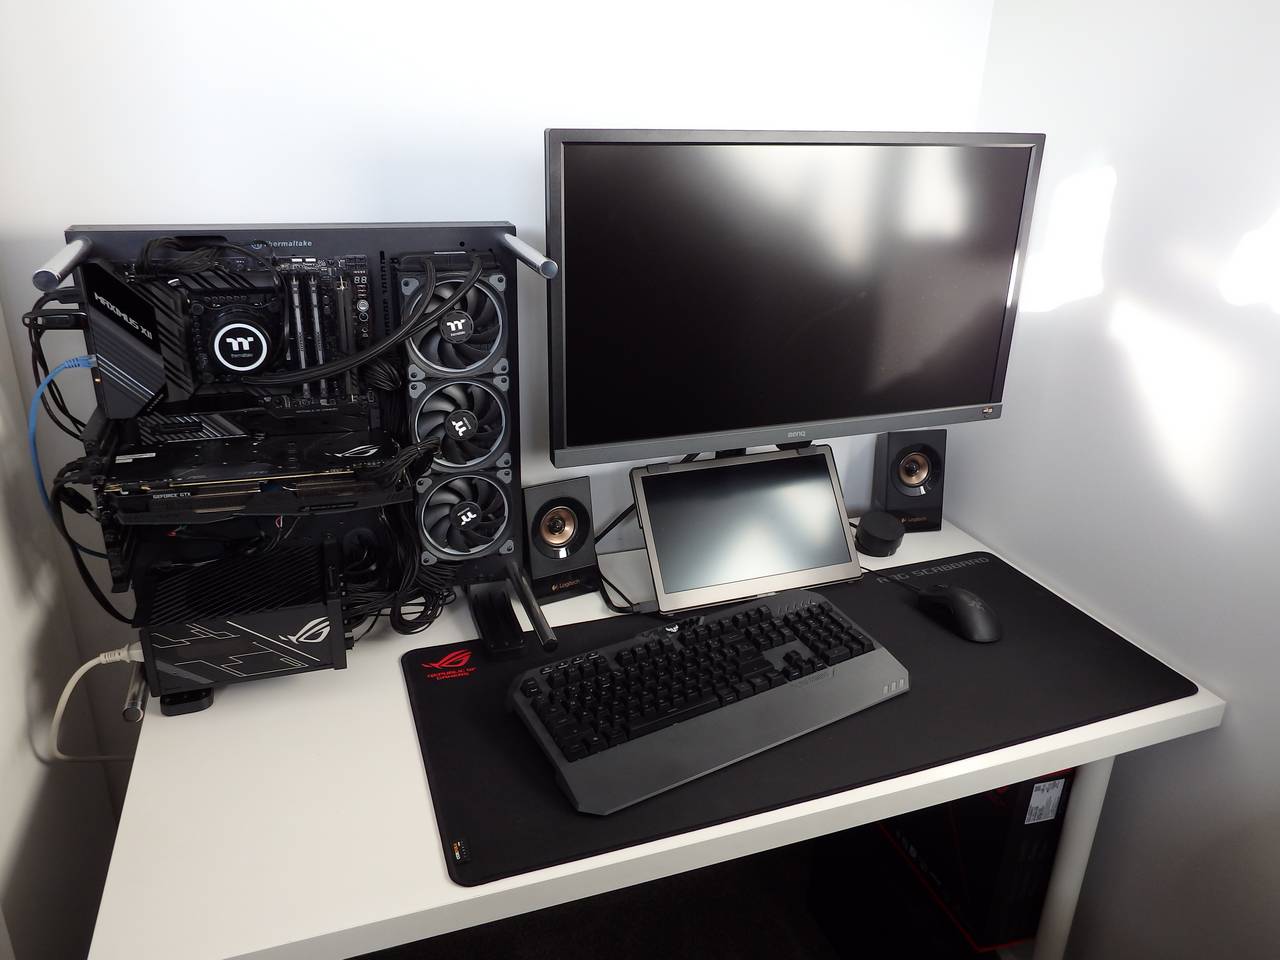
Test System specification
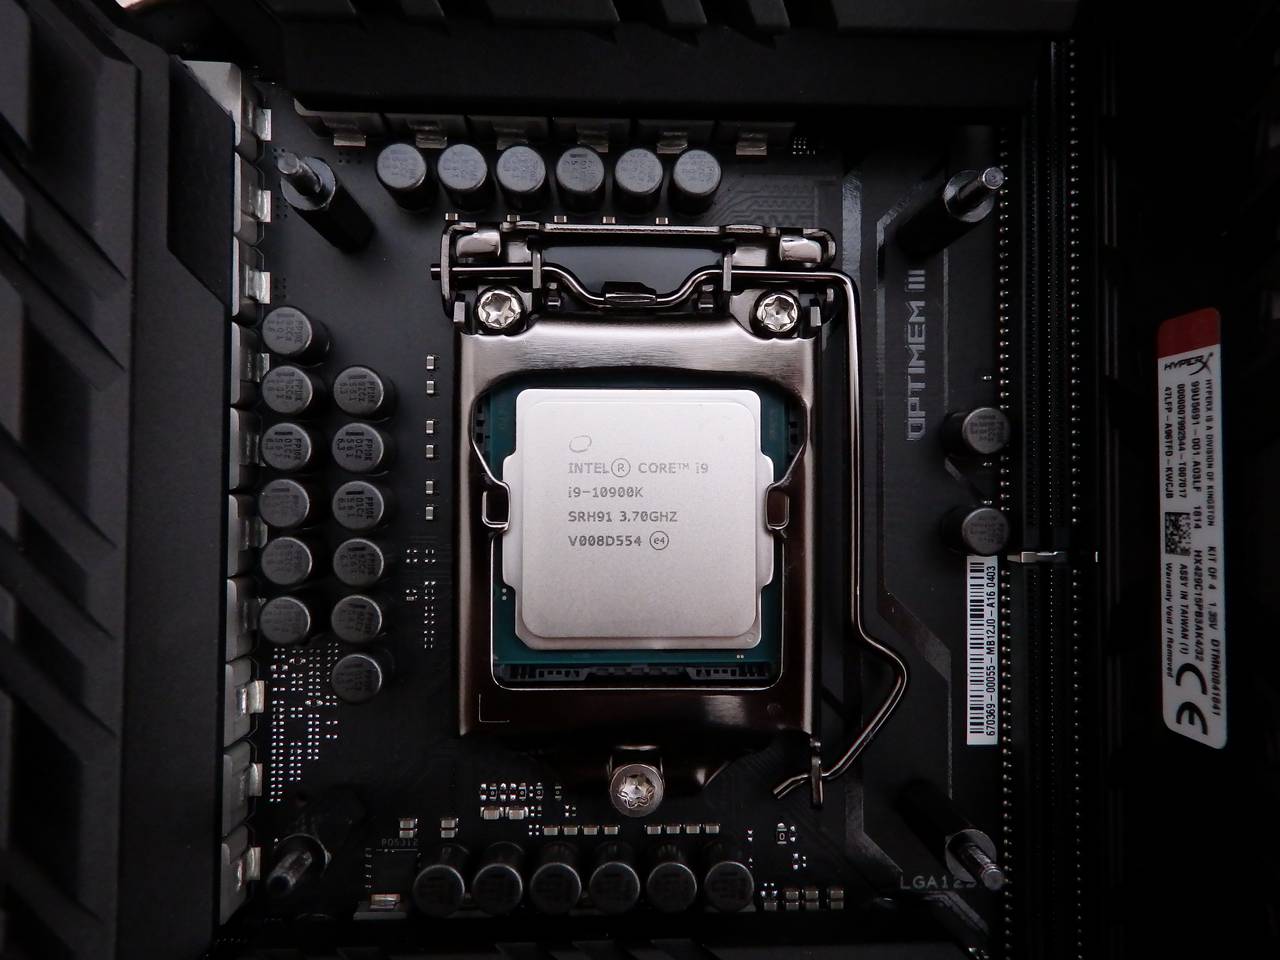
- i5-10600K & i9-10900K
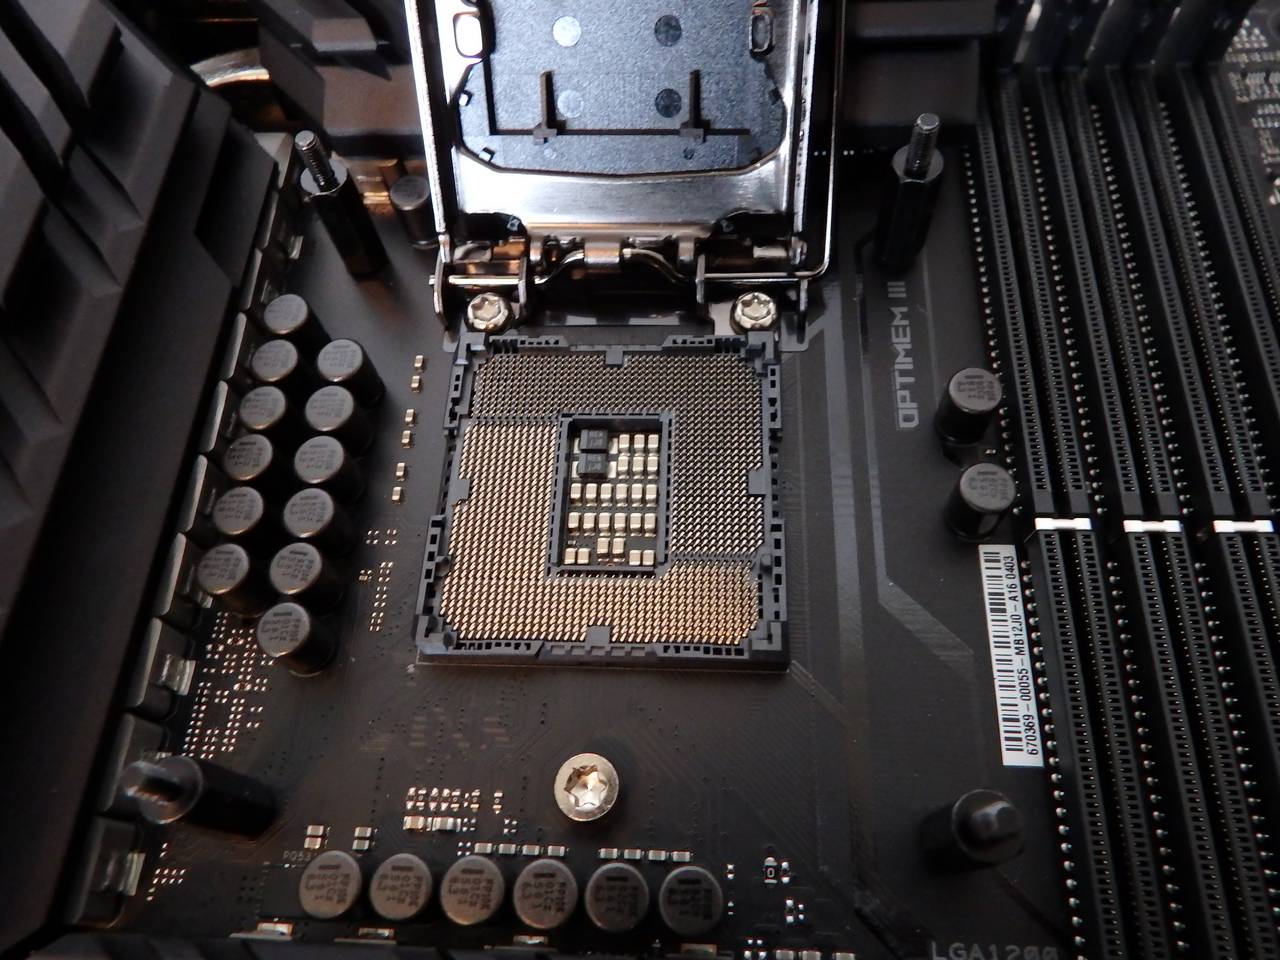
- ASUS Z490 MAXIMUS XII EXTREME with BIOS 0504
- ASUS ROG THOR 1200W Platinum PSU
- HyperX Predator RGB DDR4-2933 (2x8GB)
- ASUS ROG STRIX 1080 Ti OC
- Noctua NT-H1 thermal compound
- Thermaltake Core P3 Curved Chassis
- Thermaltake Floe 360mm AIO water cooler
- Samsung EVO 970- M.2 SSD
- Samsung EVO 250GB 2.5” SATA SSD
- Western Digital 6TB Red HDD
- BenQ EL2870U 4K monitor
- GeCHIC on-lap 1305 portable monitor
- ASUS TUF K5 Keyboard
- Razer Deathadder Chroma RGB Mouse
- ASUS ROG Scabbard Deskpad
- Logitech Z533 speakers
- Windows Professional build 1909
The ASUS Thor power supply has an OLED display on the side that shows the wattage being pulled from the wall. I didn’t see this go over 485W total system draw in the whole time I was testing.

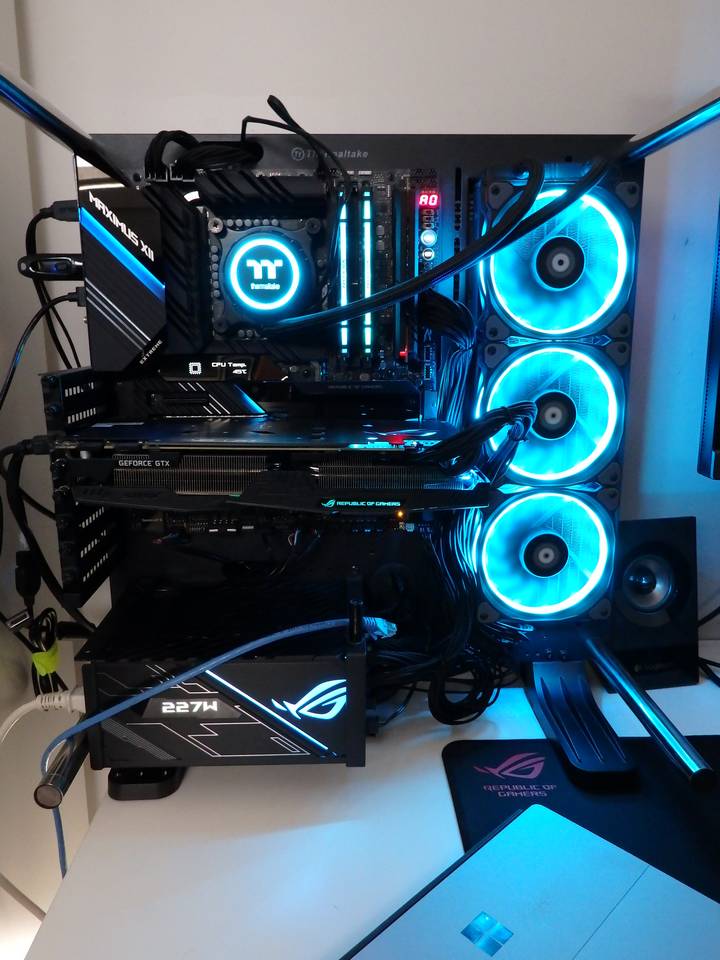

The ASUS MAXIMUS XII EXTREME is now officially the most intimidating and feature packed motherboard I’ve seen. It’s a beast with a thick backplate and top plate which is also a heatsink in that it’s alloy, not plastic. This board is heavy but it remained cool and stable throughout all testing. At around $1500 AUD it would want to be pretty special – and after using it for a week I’d agree that it is.
Test Results
I’ll start with the Synthetic productivity benchmarks, work through the in-game benchmarks and then discuss some subjective gaming experience metrics that are less reproducible. Many of these benchmarks are available for free or as a demo so you can compare the results I obtained with your own systems.
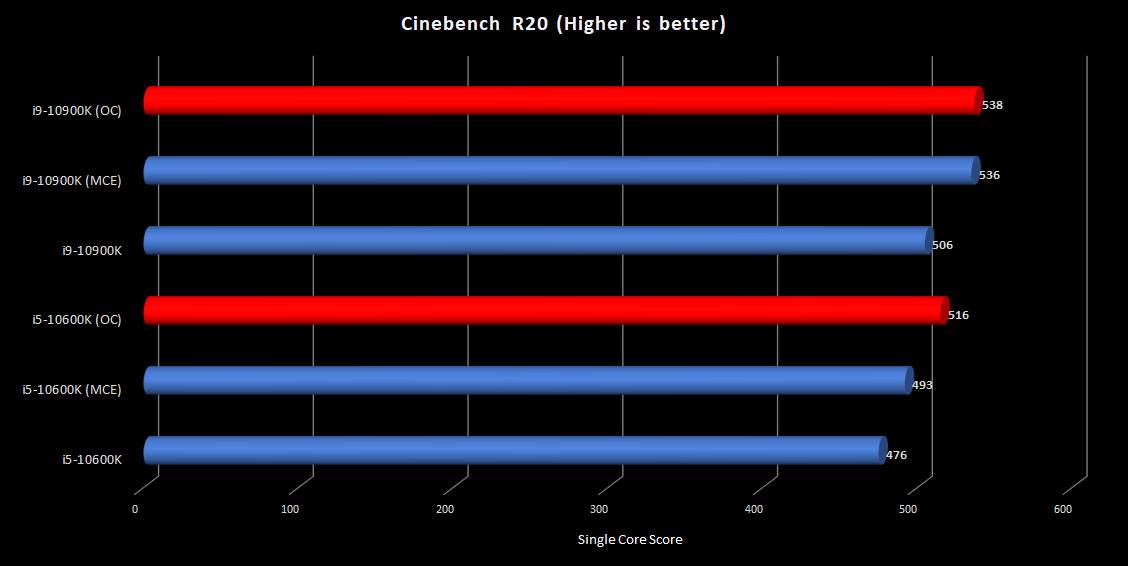
Cinebench R20
Single core performance was relatively close – especially with the MultiCore Enhancement active. The gap really opens up when the extra 4 cores/8 threads of the i9-10900K enter the equation boosting to 4.9GHz across all cores.


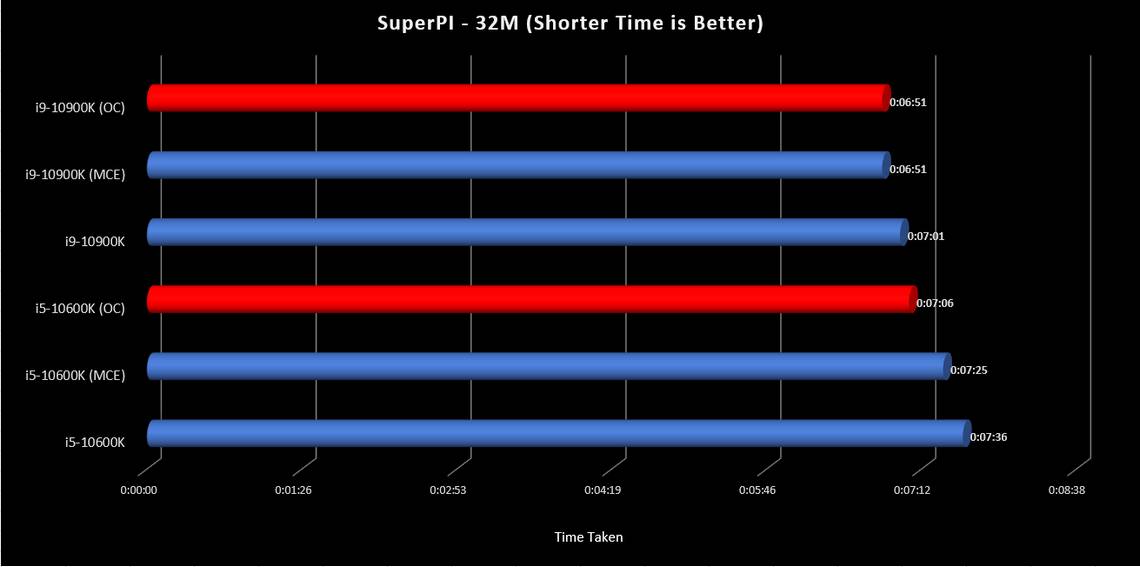
SuperPi
All up there was about a 30 second difference between the CPUs in single threaded SuperPi at stock or MCE settings.

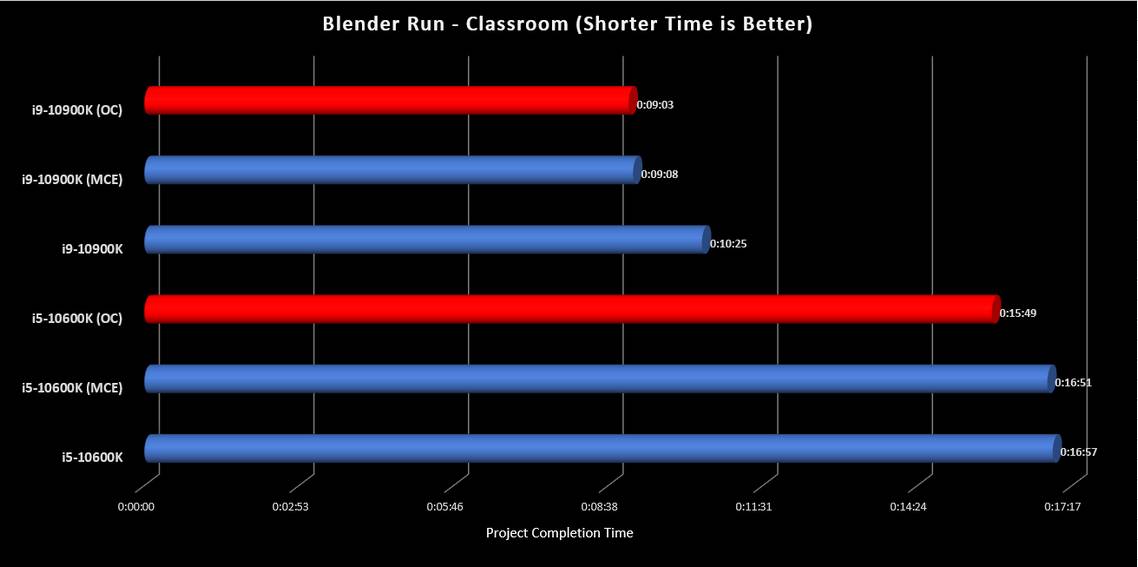
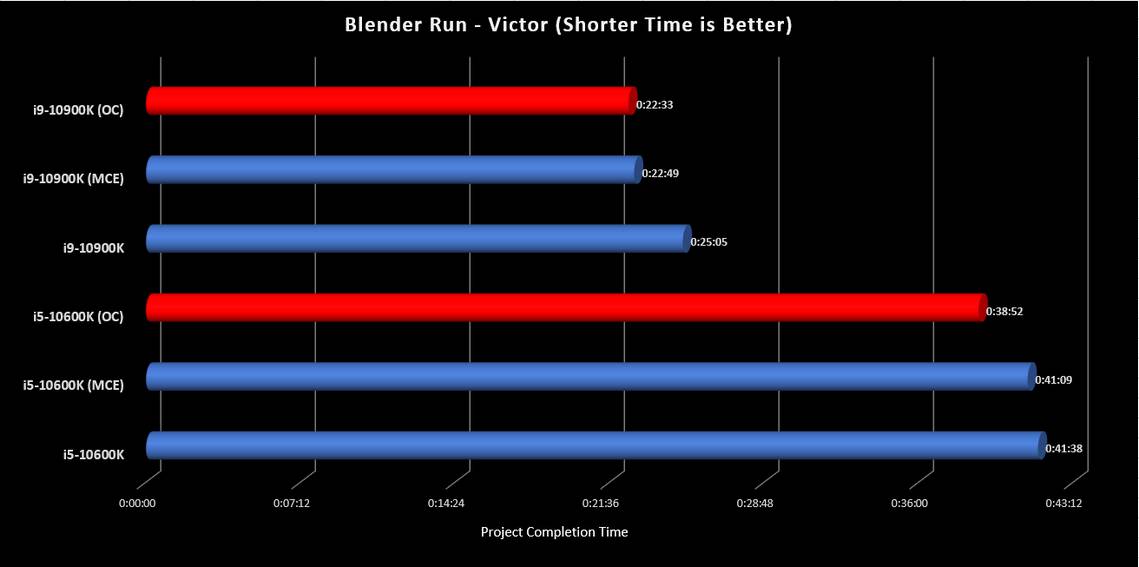
Blender
I run two workloads in Blender for benchmarking. One is the typical ‘Classroom’ render and the other is a larger ‘Victor’ project that takes longer and is more likely to flush out any thermal or power limit issues from a sustained run.


In both of the Blender benchmarks we see the advantage of MCE when applied to 10 cores for the i9-10900K as the removal of the power limits. The i9-10900K with MCE enabled does the workload in almost half the time of the stock i5-10600K.
PCMARK 10

MCE doesn’t provide much advantage to either CPU in this test. The i9-10900K leads the way – more notably in the Digital Content Creation elements.
Veracrypt

Unigine Heaven and Valley
Although generally very close, the removal of power limit restrictions for the i9-10900K with MCE shows a consistent difference across both benchmarks.


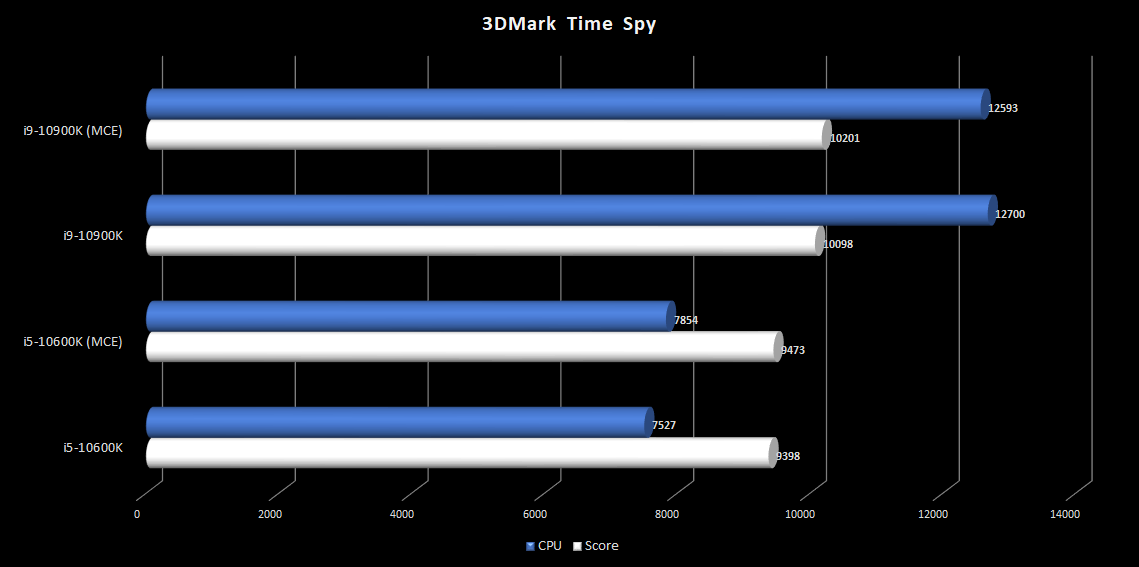
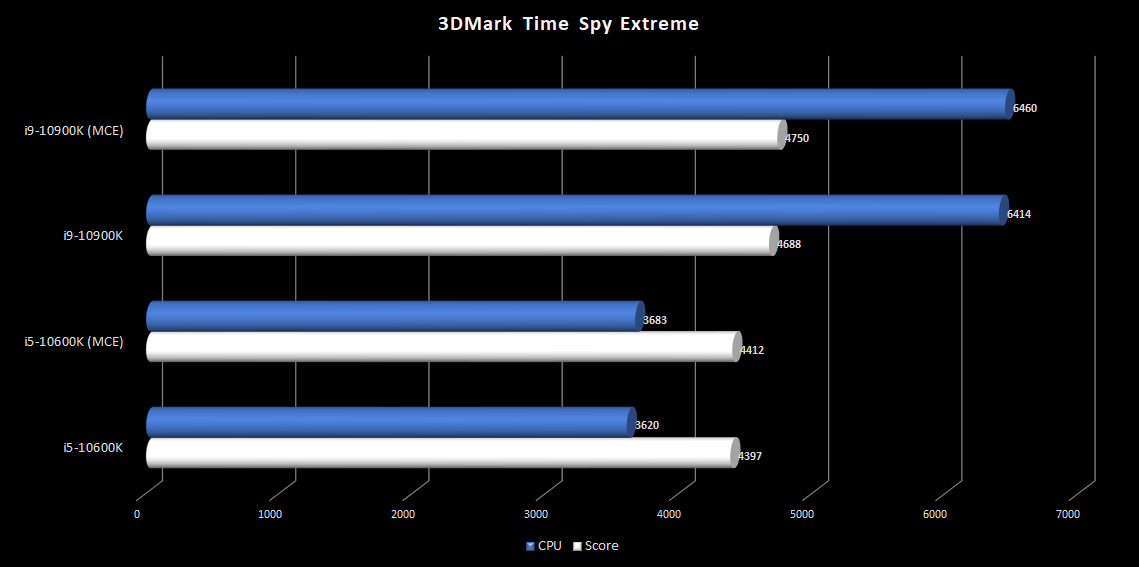
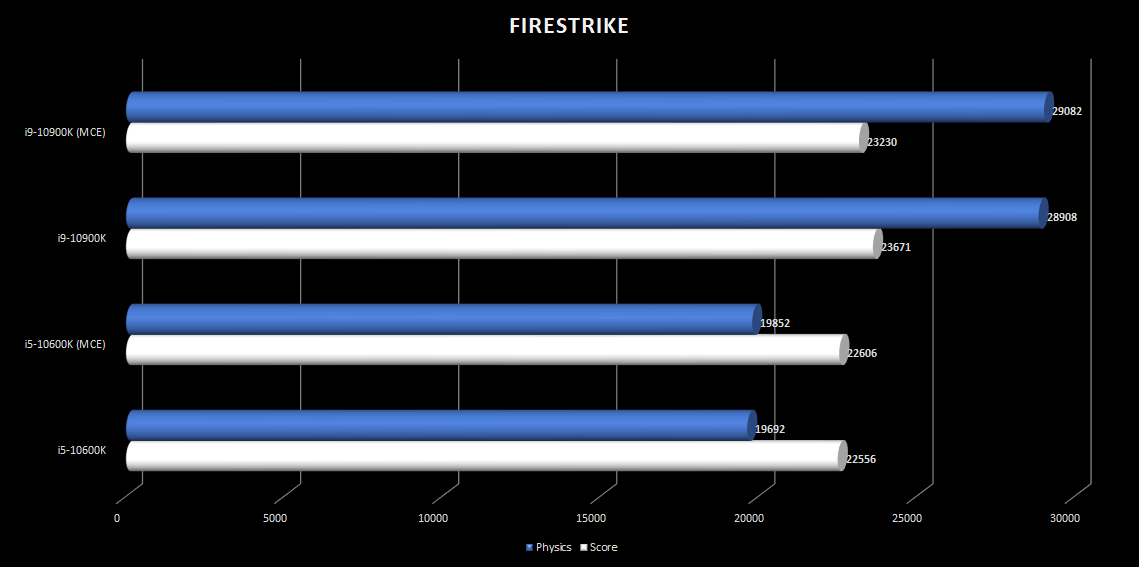
3DMARK
The Firestrike Ultra and Extreme are more GPU impacted in terms of the overall score but the physics scores show the benefits of the higher spec i9-10900K. The activation of MCE made no tangible difference to the scores in these tests. TimeSpy and TimeSpy Extreme also had similar scoring patterns with higher difference in the physics/CPU elements between the CPUs but the i9-10900K saw a more visible overall score advantage.


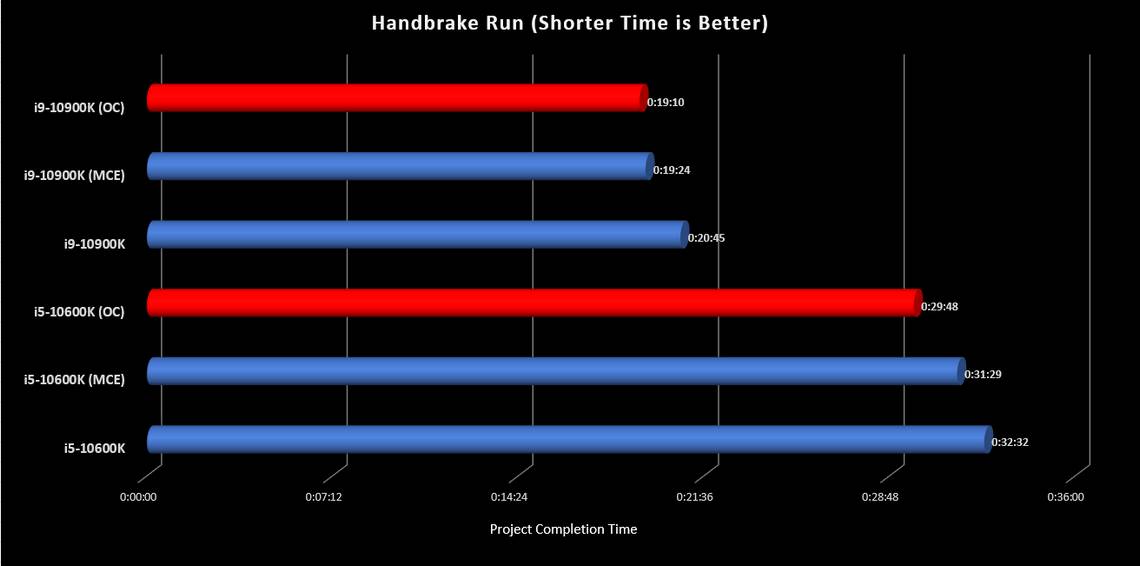
Handbrake
The Handbrake test involves running the same 4.3GB video file through Handbrake and enabling the log file to compare timestamps from the start and completion of the run. The source file and destination location are on different SSDs.

As expected, the i9 dominated this test with the superior core count.
Gaming Benchmarks
I’ve included a cross section of in-game benchmarks from a number of games. All games were tested at 1080p to reduce the impact of the GTX 1080 TI bottlenecking the result. These are all in-game benchmarks for consistency.
Shadow of the Tomb Raider
I tested Shadow of the Tomb Raider on the High pre-set.

Tom Clancy’s The Division 2
This was tested on the Ultra pre-set with VSync disabled.

Hitman 2
Hitman 2 was tested at Ultra settings in DX12

GTAV
GTAV was tested using our normal testing configuration below:


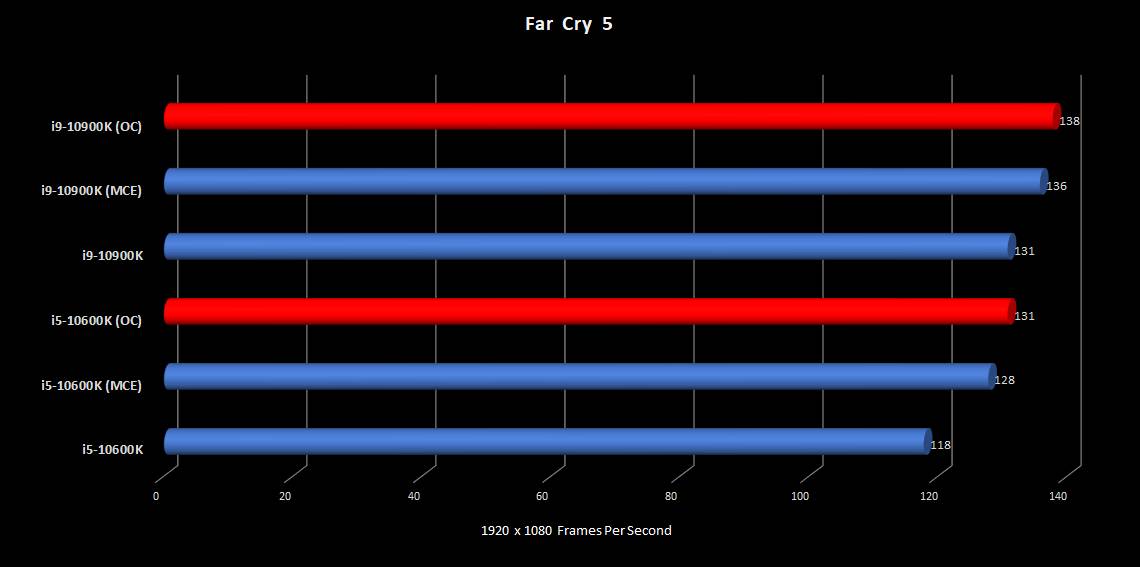
Far Cry 5
Far Cry 5 was tested using the Ultra pre-set.

The results are considerably close in Shadow of the Tomb Raider (~5fps), dead-even in the Division 2 and more noticeable in GTAV, Hitman 2 and Far Cry 5. These numbers does not take into account the CPU utilisation – in the case of the Division 2 benchmark, the i5-10600K had a CPU usage of 44% while the i9-10900K was only running at 26%.
For people who just game, the i5-10600K still has plenty left in the tank but for power users who ‘also game’ or stream/record their games for creative content then the i9-10900K has a lot more capacity for running background tasks with less impact to gameplay.
Overclocking
Overclocking was a mixed bag. The goal was to see a stable overclock at under 90C with sustained load of 45mins. I don’t consider myself more than a casual overclocker and I was really seeking an overclock that could be used for daily creative and gaming workloads rather than a ‘flash in the pan’ benchmark result.
Before I go on, my results are based on these unique CPU properties, my cooling solution, the power delivery in my review sample ASUS MAXIMUS XII EXTREME motherboard and my ambient room temperature of 22C. These variables mean that your results will likely be different – for better or worse. I’m also planning to spend more time on the overclock and will follow up in a later article.

Overclocking the i5-10600K
Spec recap: The stock all core turbo frequency is up to 4.5GHz with a single core turbo boost frequency of up to 4.8GHz and a TDP of 125W.
I managed to get an all core turbo frequency of 4.9GHz and a single core turbo frequency of 5.1GHz. This was a big improvement over the stock settings. All power limits were removed as I had adequate cooling to tame the i5-10600K. The maximum TDP value that I saw in HWiFNO64 was 155W and the maximum load temperature that I encountered was 72C. I felt that there was more headroom but if I tried higher frequencies under sustained load I ended up staring at a blue screen.
With 6 cores under the Integrated Heat Spreader (IHS) the temperatures were much better than I had expected. This was a stable overclock and the cooler was only challenged in rendering and encoding workloads. Games barely broke 60C due to the variable nature of the CPU loading, the IHS implementation and the capability of the cooling solution I was using.
The i5-10600K performance saw a nudge in creative benchmarks. Note that the i5-10600K with an overclock can catch the i9-10900K at stock intel settings in Far Cry 5 and come very close in the Cinebench and SuperPi single core benchmarks. All of this without having any thermal issues.
I’d be happy to run this overclock as my ‘daily driver’ config. Having said that, when you consider how effective the ASUS MultiCore Enhancement (MCE) is on the MAXIMUS XII EXTREME and that it is a single option in the BIOS, the return on investment of overclocking manually is low.

Overclocking the i9-10900K
The overclock on the i9-10900K was a different story. I could have and did see higher frequencies for quick benchmarks but the temperatures were over 90C.
Spec Recap: The stock all core turbo frequency is up to 4.8GHz with a single core turbo boost frequency of up to 5.1GHz and a TDP of 125W. In addition, the Turbo Boost Max Technology 3.0 frequency is up to 5.2GHz and then we have the Intel® Thermal Velocity Boost on top of that. The i9-10900K has a Thermal Velocity Boost rating of up to 4.9GHz for all core turbo and up to 5.3GHz for the favoured core.
The best result I obtained was an all core boost of 4.9GHz with the single core boosting to 5.5GHz. The package TDP rating under sustained load for this overclock maxed out at about 225W but typically sat much lower when gaming. The temperatures for gaming went into the high 70s and the frame rates were marginally higher than stock, but I was seeing temperatures of up to 84C when doing longer Blender benchmarks.
This wasn’t exactly a big boost in terms of frequency and if I went any higher to an all core overclock of 5GHz, the thermal profile would jump another 10C to over 90C without much in between and the package power was 250W+.
I also had the 3x360mm fans running at 1600RPM constantly on the Thermaltake AIO for the benchmarking but found the PWM profile to work well in general use and gaming.

The i9-10900K manual overclock didn’t translate to much of an improvement over the ASUS Multicore Enhancement in games or single core benchmarks but it made a difference in larger payloads that use all cores over a longer period of time.
In terms of an overclock from the Intel specification, there is a little headroom there. In my situation, the ASUS MCE function was able to essentially match my efforts automatically.
Taking the Easy Road
Out of interest, I tried out the AI Overclocking feature on the ASUS ROG MAXIMUS XII EXTREME and found that the results were essentially the same as what I saw but I’ll be interested to see if this improves over time as the MAXIMUS XII EXTREME claims to have AI learning that adapts over time to tweak and improve the overclock.
If you’re not confident overclocking manually, the ASUS MultiCore Enhancement function is a good option and something I’d encourage anyone with an ASUS board adorned with this feature to try out – just make sure you have a good cooler for better results.


 have landed – along with a new Z490 chipset and LGA1200 socket. This article will tell you what to expect if you’re thinking about buying a new CPU and should help you determine which one best suits your needs.)