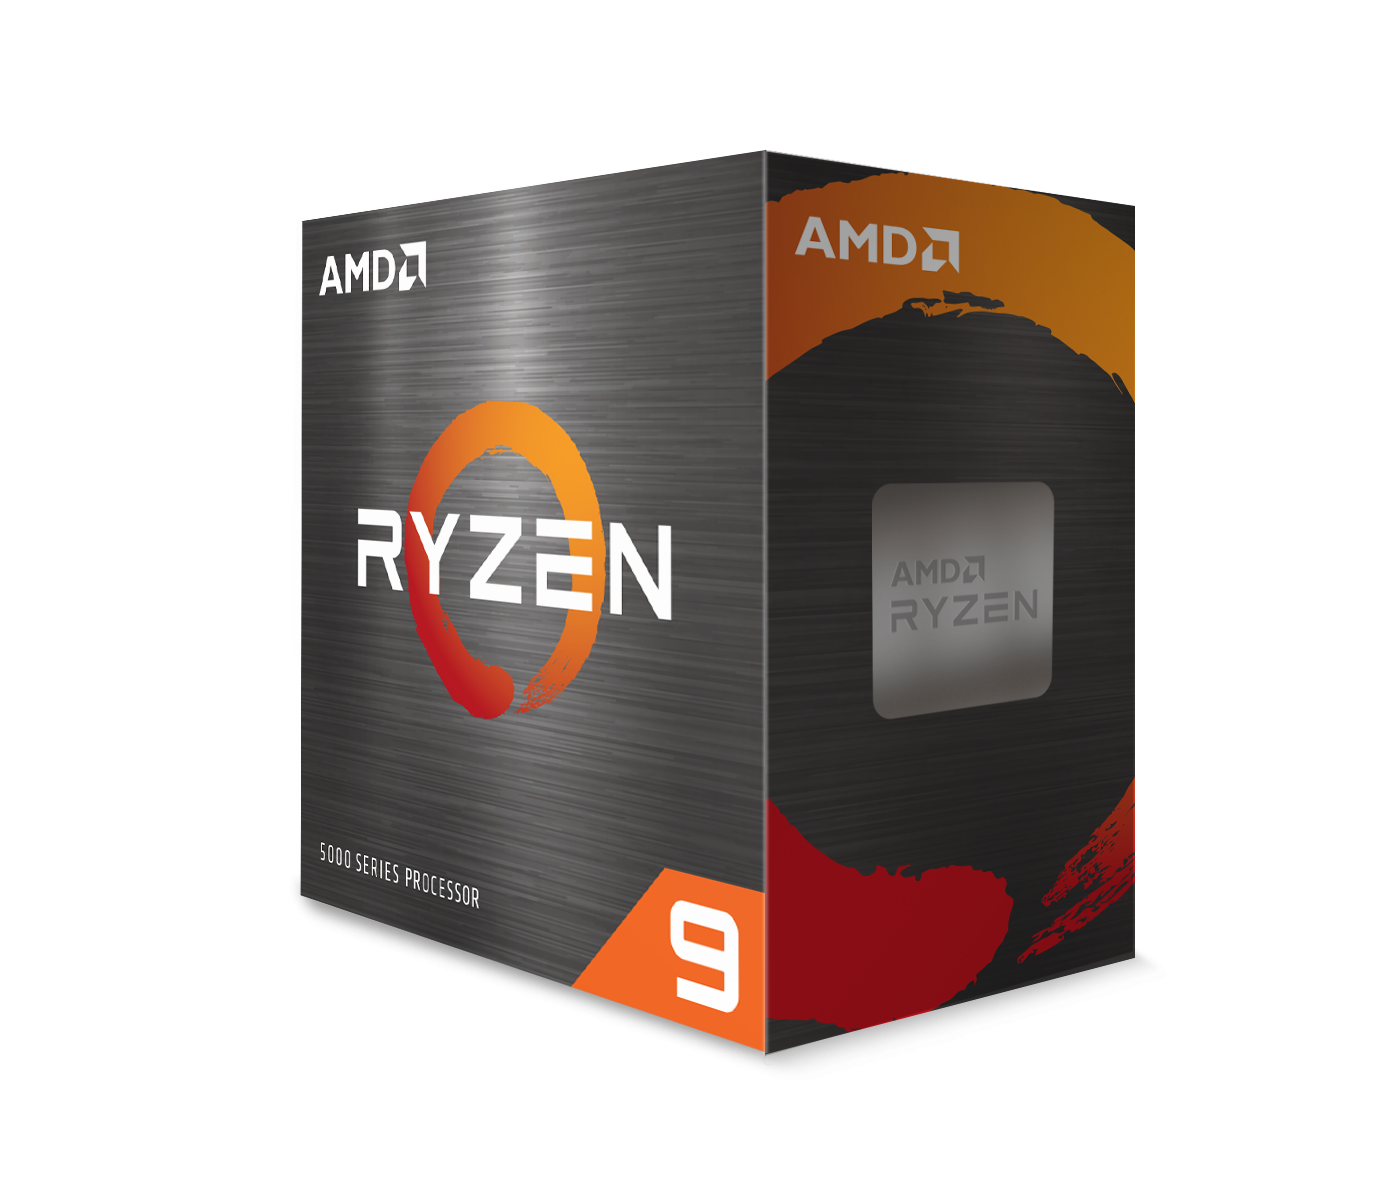
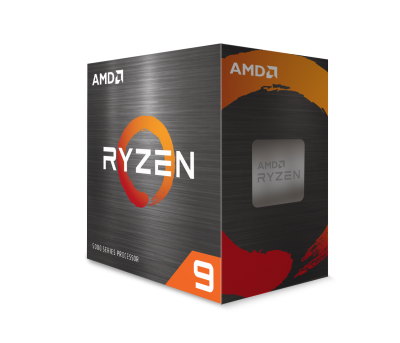
AMD’s Ryzen 9 5900X is a 12-core beast that delivers top-tier gaming performance and the type of multi-core horsepower that makes short work of creative workloads. The Ryzen 7 5800X performance really impressed us however the 5900X at $860AUD turned out the be the CPU I’ve been waiting for.
I covered Zen 3 in more detail with a brief recap of Ryzen’s evolution in our Ryzen 7 5800X review. Check that out if you are interested in more detail behind the architectural changes and why Zen 3 is such a big deal. For this review, I’ll cover the highlights and the product lineup for context.
Overview of the Ryzen 5000 Series
The new Zen 3 CPU line up consists of two Ryzen 9 CPUs (5900X and 5950X), the Ryzen 7 5800X and the Ryzen 5 5600X.
| Max Boost Base Freq | Cores Threads | L2+L3 Cache | TDP | Chiplets | |
| Ryzen 9 5950X | 4.9 GHz 3.4 GHz | 16 32 | 8MB L2 64MB L3 | 105W | 2x CCD 1x IOD |
| Ryzen 9 5900X | 4.8 GHz 3.7 GHz | 12 24 | 6MB L2 64MB L3 | 105W | 2x CCD 1x IOD |
| Ryzen 7 5800X | 4.7 GHz 3.8 GHz | 8 16 | 4MB L2 32MB L3 | 105W | 1x CCD 1x IOD |
| Ryzen 5 5600X | 4.6 GHz 3.7 GHz | 6 12 | 3MB L2 32MB L3 | 65W | 1x CCD 1x IOD |
The boost frequencies depend on power delivery and thermal parameters to be optimal but with typical cooling relative to the price point of the processor, this shouldn’t be a problem. Our test platform uses a 240mm AIO water cooler and we saw the 5900X frequencies hitting and often nudging 4.95 GHz at stock settings.
Note that the 65W Ryzen 5 5600X is the only model that comes with a CPU cooler, the Wraith Stealth. Given how capable the Wraith Stealth has historically been with 65W processors, this supports the value proposition of the 5600X and will make it attractive to those wanting performance but without a large outlay.
At 105W, the Ryzen 9 and Ryzen 7 models will be sought after by creators, enthusiasts and high-end gamers who would most likely bypass a stock cooler and pair these CPUs with higher-end air or water coolers. This omission of stock coolers for high-end processors is now considered the ‘norm’ with Intel also making the same decision.
Key Features
Let’s start with what’s the same.
Zen 3 is built on what is essentially the same 7nm manufacturing process as Zen 2. This should be good for yields as it’s a mature process that currently works. The socket and power requirements are the same as Zen 2 and older AMD 400 series motherboards will be able to support Zen 3 with a BIOS update.
AMD has been able to use the same I/O die as 3rd generation and change the Core Chiplet Die (CCD) from the Zen 2 technology to the Zen 3 in a non-disruptive modular way. PCIE 4.0 has also been retained per Zen 2 which is an advantage over the current alternative platform.
What’s changed?
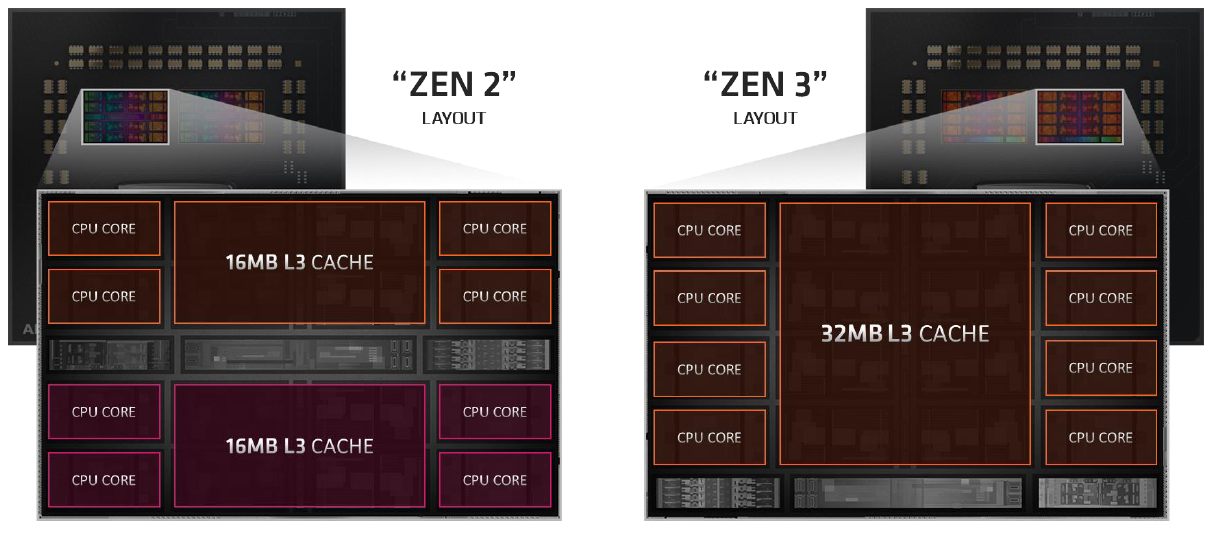
Zen 2 architecture uses a Core Chiplet Die (CCD) made up of 2 Core Complexes (CCX). A Zen 2 Core Complex (CCX) consists of 4 cores and 16MB of L3 cache shared across the 4 cores of the CCX – which means that an absolute maximum of 16MB of cache is available to any core. After observing different workloads including gaming workloads, the engineers at AMD noted the large amounts of data going through the L3 cache and made a key change.
Zen 3 keeps the L3 Cache to core ratio the same at 4MB per core but the big change is the implementation of a Unified CCX with up to 8 active cores and 32MB of shared L3 cache. What this means is that for lightly threaded workloads, the active threads have twice as much shared cache available to them and with lower latency. An example workload that fits this profile would be gaming where there are a lower number of threads under load that can take a bigger share of the L3 cache. In the context of the Ryzen 9 5900X, both Unified CCXs have 2 of the 8 cores disabled with 6 active cores per CCX. In this scenario, the shared 32MB of L3 cache remains available to the active cores in the CCX which still delivers the same benefits in lightly threaded workloads. The Ryzen 9 5900X uses two Unified CCX connected via Infinity Fabric to deliver 12 cores and 64MB of combined L3 cache. The Ryzen 9 5950X has all cores enabled for 16 in total and the same 64MB of L3 cache.
Image source: AMD
The result of a unified CCX is that core-to-core communication is faster, core-to-cache communication is faster and the cores themselves can do more per cycle. What we see here is an increase in Instructions per Cycle (IPC), lower latency and improved efficiency via better performance per watt.
Microarchitecture
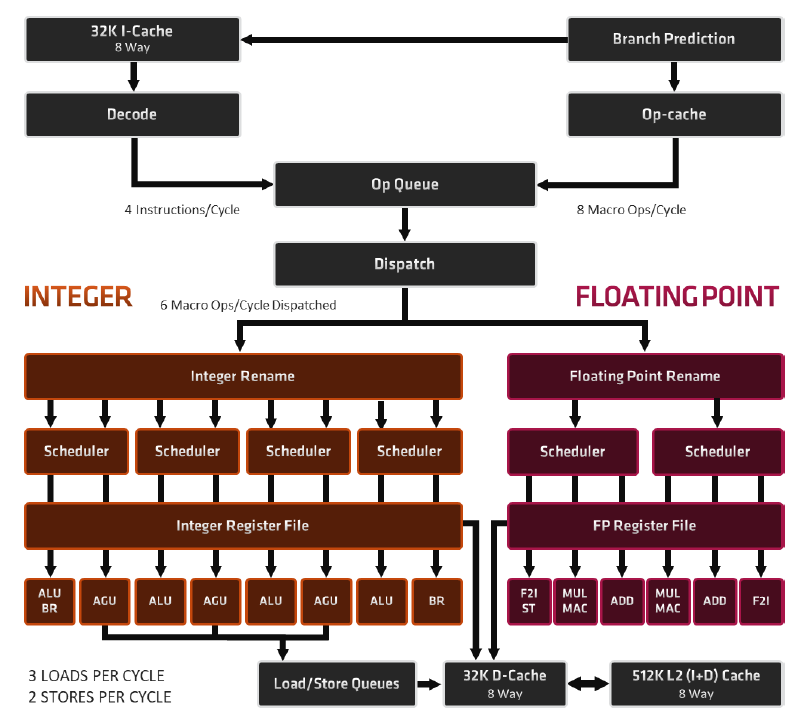
Image source: AMD
Enhancements have been made to the way branch prediction works and the fetching of instructions. There was a focus on running multiple predictions and having faster recovery from mispredictions. Latency reductions have been achieved by methods including a larger integer window and an increase to Floating-Point bandwidth from the Zen 2 architecture. Zen 3 also has higher load and store bandwidth compared to the previous generation to support the enhanced instruction execution.
Three particular clock speeds are most important to Zen 3: Infinity Fabric, Unified Memory Controller, and System RAM all have their clock speeds linked in a 1:1:1 ratio which essentially means that faster RAM will deliver a faster system.
- Infinity Fabric (fclk) defines the speed that the CPU cores will communicate across CPU dies and with the SoC Controller for PCIe, USB and SATA devices (storage, graphics cards, network interface cards).
- Unified Memory Controller (uclk) controls the speed that commands can be received or sent from the CPU to RAM
- System RAM (mclk) the speed of the System Memory, RAM.
The Precision Boost 2 algorithm has been tweaked further and still performs well. This takes into account the socket power, VRM thermals and current in real-time, adjusting the boost frequencies to get the most out of the CPU for each workload in a safe and efficient way.
In Summary
At a basic level, performance is equal to IPC x Frequency x Core Count.
Zen 3 retains the same core counts and similar frequencies as Zen 2 (compared per model) but has a refined architecture that increases the IPC value of that basic equation. Essentially, Zen 3 just works smarter with more IPC rather than harder through higher frequency or increased core count to get better performance. This also makes Zen 3 more competitive than before in lightly threaded workloads – like games – without sacrificing the multi-threaded advantage it already had.
BIOS updates for X470, B450, B550 and X570
If you already have a 400 or 500 series motherboard, you will need to update to the latest BIOS from your motherboard manufacturer that supports the Ryzen 5000 series CPUs. For testing, we were provided a BIOS from AMD that was not publicly available which is normal practice for both Intel and AMD.
BIOS updates for X570 and B550 boards were available at launch, X470 and B450 BIOS updates are expected in January 2021 but may vary from manufacturer to manufacturer. The good news here is that AMD is supporting the 400 series chipsets which is great for people looking to upgrade from their second-generation Ryzen processors and enjoy some of that improved IPC performance that comes with the Ryzen 5000 series.
Test Platform
Notes
- Second Generation Ryzen 7 2700X and 3800XT were included to show how far AMD has come with the Zen architecture and the value of an upgrade.
- The Intel i9-10900K has 10 cores/20 threads, costs $40AUD more than the 5900X and is the Intel Mainstream flagship processor. All Intel power limits are in place per the Intel specification though I have used Multi-Core Enhancement (MCE) on our ASUS Z490 Maximus Extreme XII as this is a typical ‘out of the box’ configuration for a fair comparison.
- CPU core and thread counts have been included in brackets after each CPU title to help make the specs clearer in the graphs.
- I acknowledge that all of these CPUs can be overclocked and/or have power limits relaxed/removed to perform better but your mileage will vary depending on individual CPUs and supporting hardware. The i9-10900K is a different animal when you disable the power limits as seen in our prior review – however, this changed the performance per Watt and thermals significantly. For the purpose of bench-marking we haven’t gone down that rabbit hole and what you see here is essentially the “out of the box” experience that is guaranteed by the manufacturer.
Test methodology
- 3 runs and an average result taken (any clear positive or negative outliers were excluded for all CPUs)
- Windows 10 Pro build 2004 and NVIDIA 456.71 graphics drivers were used. No GeForce Experience installed nor was G-SYNC enabled.
- No antivirus was installed
- HWiNFO64 was used to measure system metrics.
Test System
- AMD Ryzen 9 5900X
- Gigabyte X570 Aorus Master Motherboard
- HyperX Predator RGB DDR4 2933MHz (2x8GB)
- Fractal Design Celsius S24 AIO water cooler
- 1TB Kingston KC2500 M.2 NVME SSD
- 6TB WD Black
- ASUS RTX 2080 Ti Strix OC
- ASUS THOR 1200W PSU
- Thermaltake Core P3 Curved case
Editor’s note: I want to thank AMD and Gigabyte for the loan of the X570 Aorus Master motherboard for testing. This board has been brilliant and is one I’d happily buy for a personal build.
Test Results
It’s worth keeping in mind that the 12-core Ryzen 9 5900X holds a 2-core advantage over the 10-core Intel i9-10900K however the 5900X costs $40AUD less. This means that one could logically expect the 5900X to perform better in multi-threaded workloads by virtue of having more cores available to do the work.
Synthetic Testing
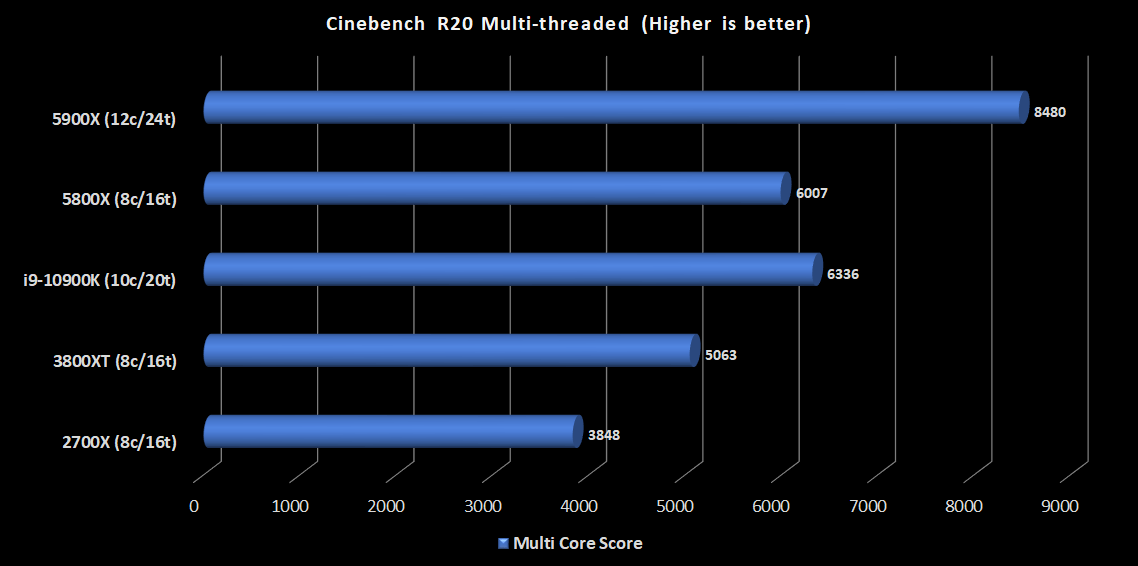
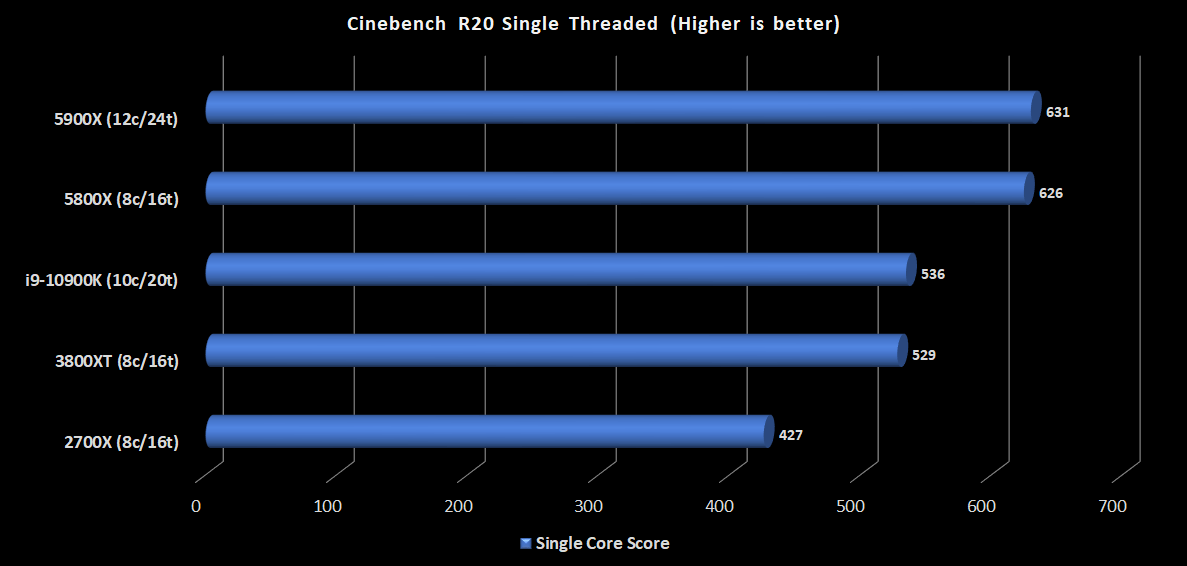
Cinebench
Cinebench is an easy benchmark to obtain and run to compare your system against the ones in the graphs.
The 5900X benefits from those extra cores in the multi-threaded test by more than 30%. This is massive given the price point. When looking at single-core performance, the 5900X performs essentially the same as the 5800X but both easily beat the i9-10900K by almost 100 points.
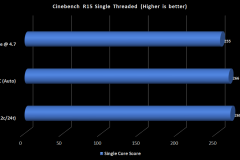
Cinebench R15 graphs tell the same story and have been included below as I often get asked for R15 scores when I leave them out.
Blender Multi-Core Rendering
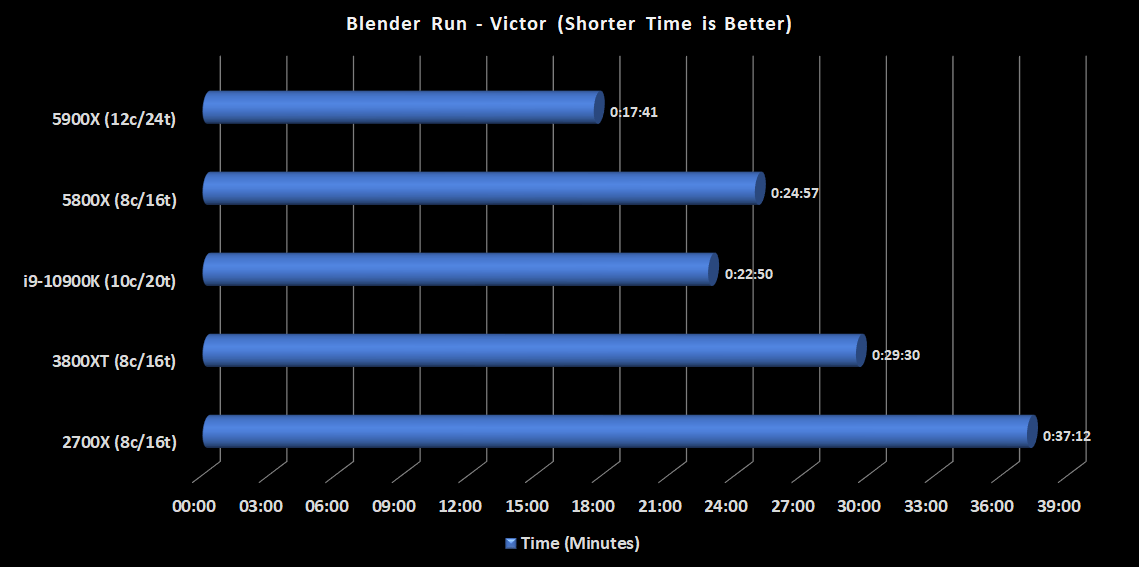
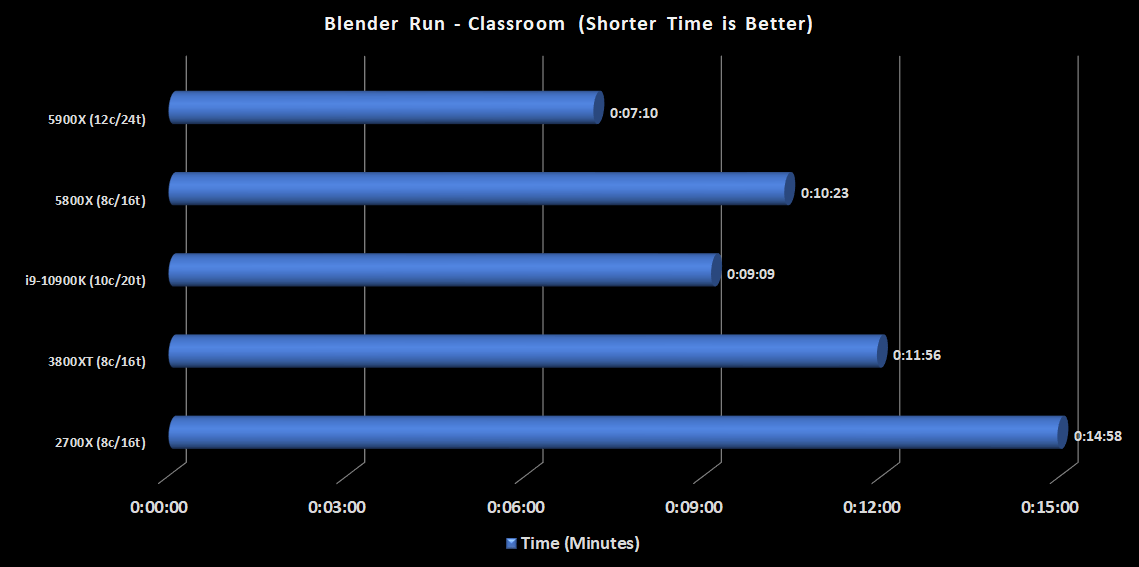
Blender is a 3D rendering application that loads up all cores and renders a scene. We use the shorter “classroom” test file and a larger, more complex “Viktor” file so that we can see how CPU power limits and thermals can impact shorter and longer workloads.
Viktor
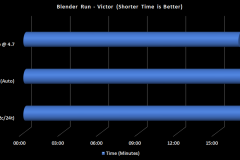
The Ryzen 9 5900X made short work of the Viktor project, completing the workload in just 17 minutes and 41 seconds. This result is a little over 7 minutes faster than the 8-core Ryzen 7 5800X and almost 5 minutes faster than the i9-10900K. The benefit of the 5900X to creators is clear in this test.
Classroom
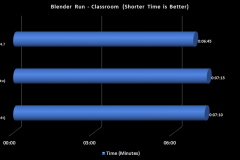
Classroom is a shorter project so any differences are going to be smaller than the Viktor workload. The 5900X completed rendering the Classroom project in 7 minutes and 10 seconds, 3 minutes faster than the 5800X and 2 minutes faster than the i9-10900K.
Single-Core Performance with SuperPi
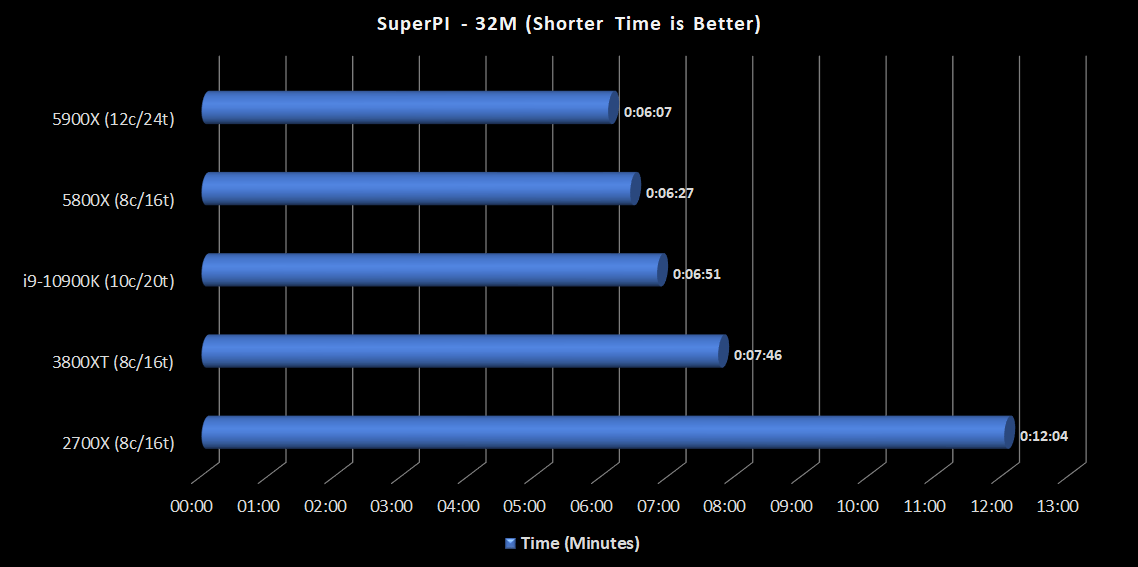
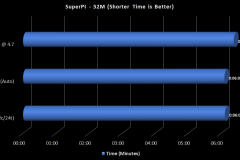
This is an older test for single-threaded performance but it is still useful to observe the core selection of the 5900X. As per the 5800X testing we did previously, the ‘favourite’ or best performing cores as flagged in Ryzen Master were the only cores consistently allocated to SuperPi workload and these hit maximum frequency peaks of 4950MHz during the test.
Veracrypt Encryption/Decryption
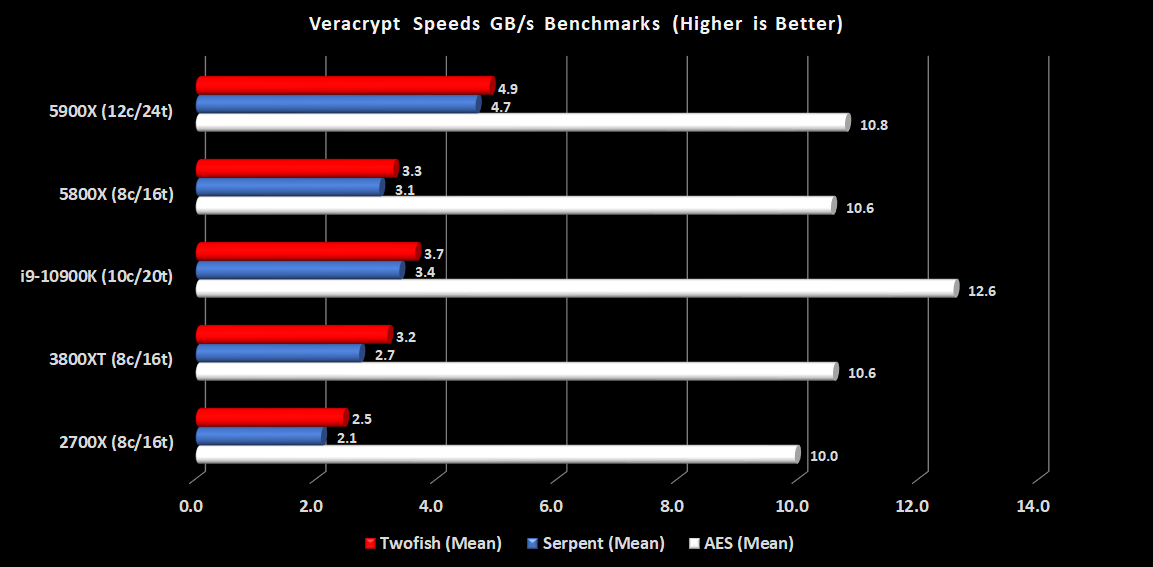
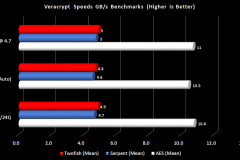
The i9-10900K takes the points here in the AES benchmark but the Twofish and Serpent results are comprehensive wins for the 5900X.
PCMARK10
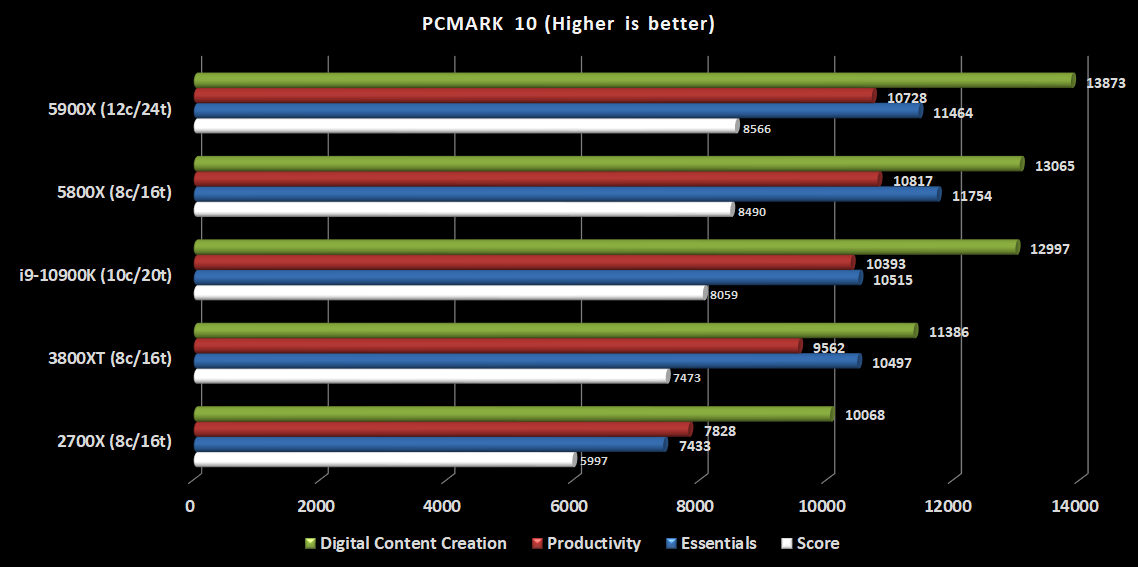
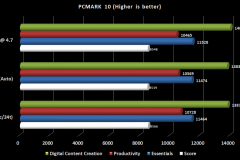
This benchmark runs a variety of workloads from office-based applications through to creator and entertainment simulations. The result is a repeatable all-around score with a breakdown of the subcategories to help us understand the strengths and weaknesses of each processor in the list.
These results are interesting in that the 5800X and 5900X perform very similarly except in the Digital Content Creation component of the benchmark where the additional cores appear to make a difference. The result is still a win over the i9-10900K.
UL Benchmarks Futuremark
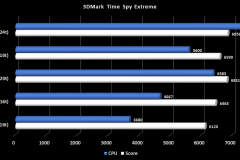
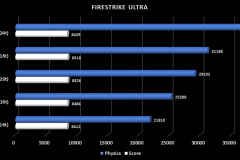
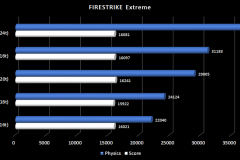
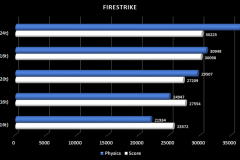
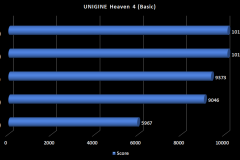
The synthetic gaming benchmarks in the UL Benchmark suite show that the physics performance of the 5900X beats the rest of the field in the Firestrike series. DX12 Time Spy testing hands a narrow win to the i9-10900K. The overall score for the Time Spy Extreme benchmark goes the way of the 5900X over the i9-10900K but only just – although the physics component performance is significantly stronger in the 5900X result. The Heaven basic results were a draw between the Zen 3 CPUs with both handily beating the i9-10900K.
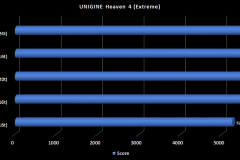
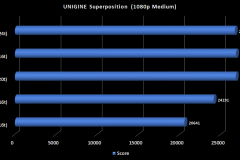
Superposition had the i9-10900K and both Zen 3 CPUs essentially tie while the Unigine Valley Extreme benchmark had the 5800X and 5900X tied but slightly beating the i9-10900K.
Unigine Benchmarks
For whatever reason, the 5800X narrowly beats the 5900X in the Heaven 4 Extreme benchmark over a 3-run average and the results were all consistent.
Game Benchmarks
The synthetic gaming benchmarks showed that there wasn’t much difference between the 5800X, 5900X and i9-10900K in terms of gaming workloads with a top-end card like the NVIDIA RTX 2080 Ti.
Next, we’ll go through the in-game benchmarks that we prefer over manual ‘play-through runs’ due to automated in-game benchmarks being repeatable and they don’t have a human variable. Consistency is key here.
Far Cry 5
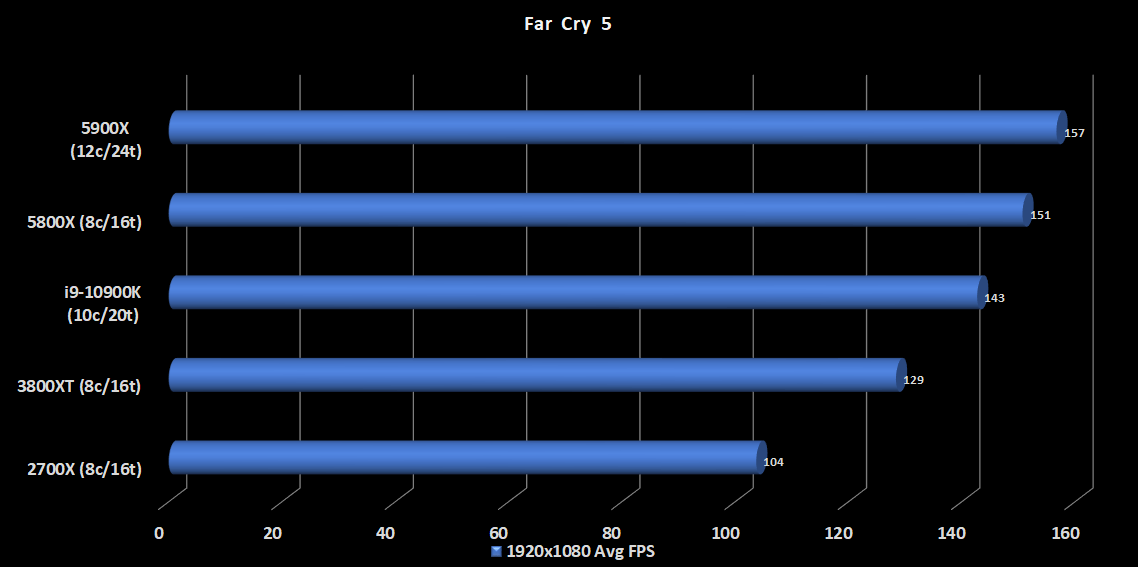
Far Cry 5 was tested on the Ultra preset at 1920×1080.
Leading the chart with 157FPS, the 5900X scores a small 6FPS lead over the 5800X but a notable 14FPS margin over the i9-10900K.
GTA V
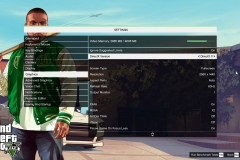
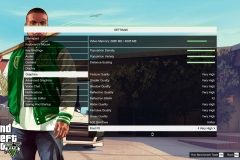
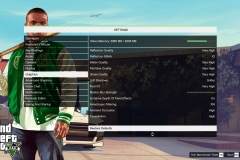
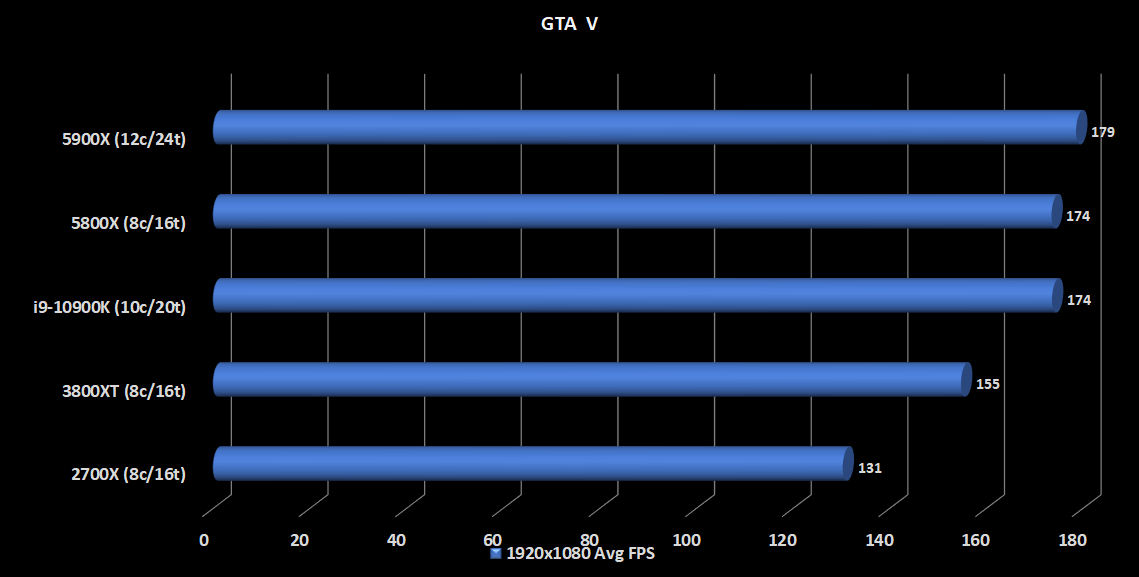
Benchmarked with the following settings at 1920×1080 resolution.
The 5900X demonstrated a technical win of 5FPS over the 5800X and i9-10900K but in real-world use, this wouldn’t be noticed.
Hitman 2
At 1920×1080, Hitman 2 delivered a surprise result of 106FPS as an average for the 5900X, placing it a little over 10% faster than the 5800X and i9-10900K.
Rainbow Six: Siege
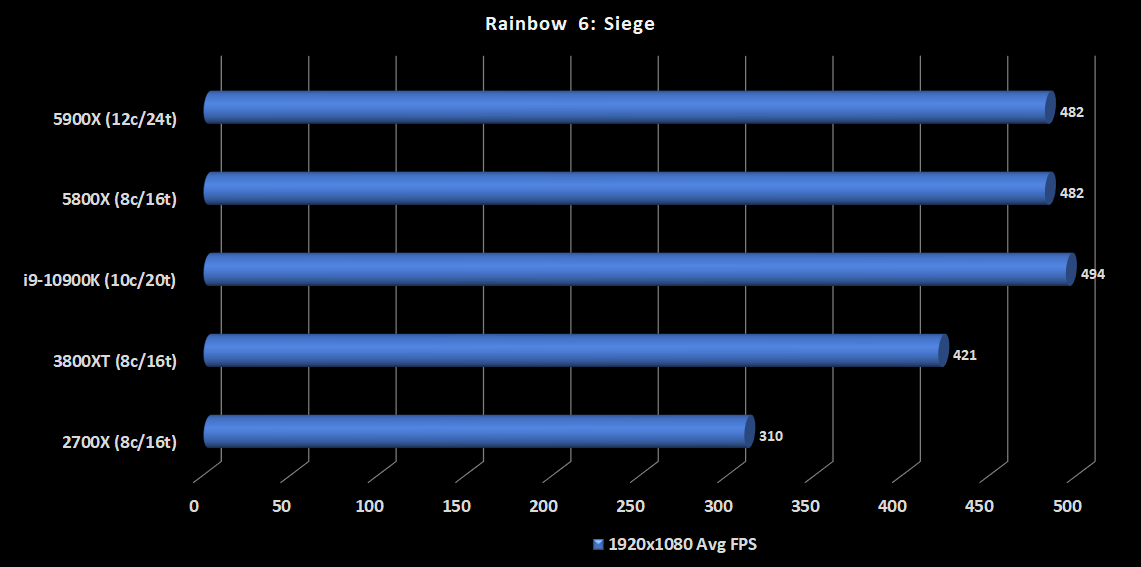
Tested at Ultra settings preset with a resolution of 1920×1080 using Vulkan.
This game can deliver some extremely high frame rates and we used it recently in our 360Hz ASUS PG259QN monitor review because it is one of the few titles that can actually deliver such a high frame rate. The Intel i9-10900K takes the points here and we see both the 5800X and 5900X tied for second place.
Shadow of the Tomb Raider
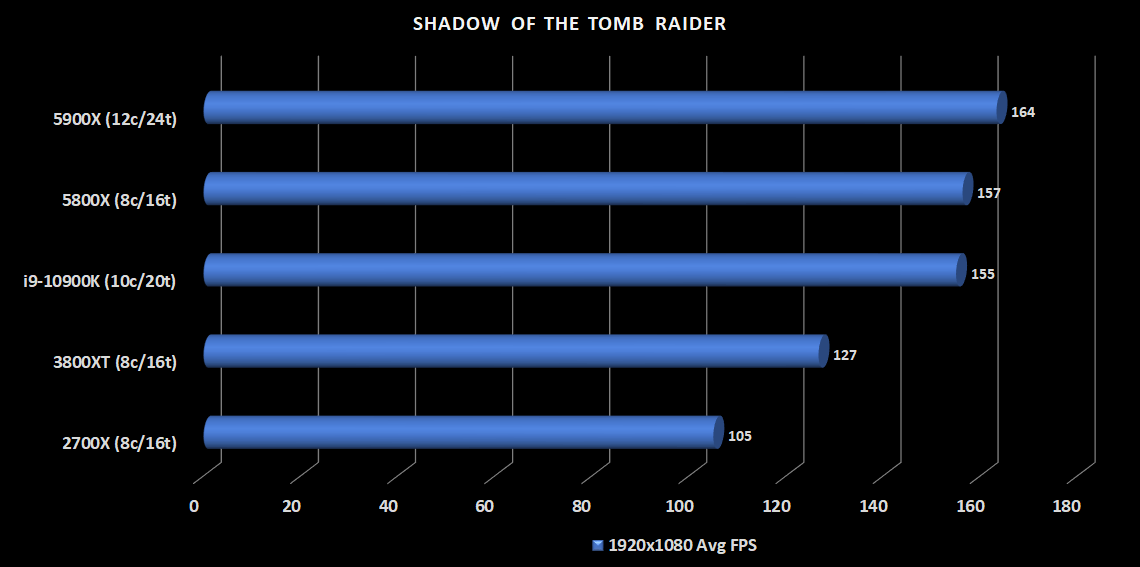
Tested at 1920×1080 with the Highest preset.
The 5900X led the pack here by 7FPS on average with the 5800X and i9-10900K effectively tied for second place.
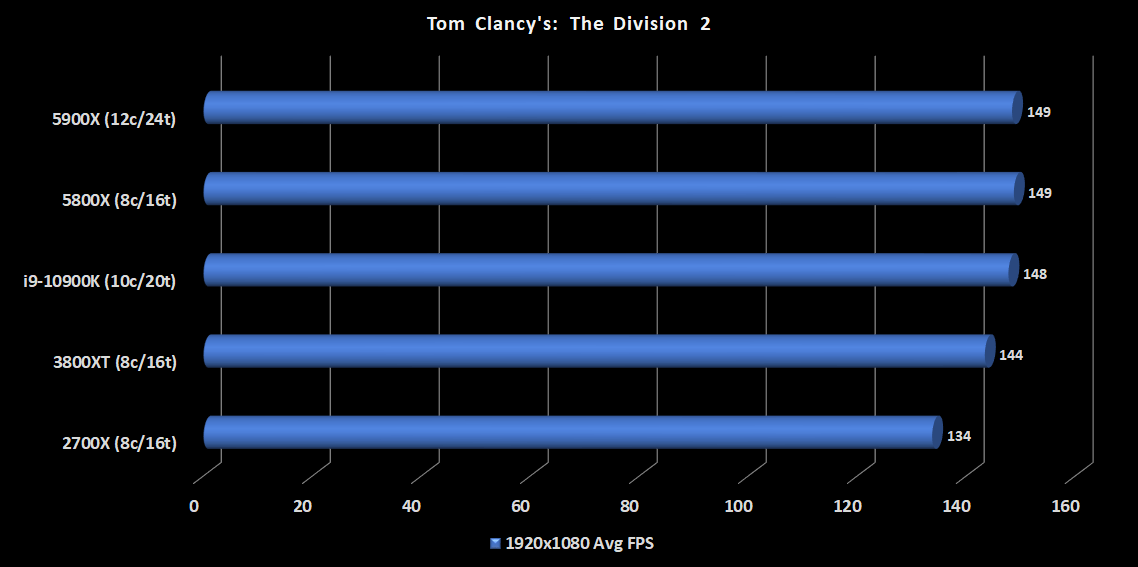
Tom Clancy’s: The Division 2
The Division 2 was tested at Ultra settings with V-Sync disabled (it enables V-Sync by default), DX12 and a resolution of 1920×1080.
This was a close one as it isn’t overly CPU intensive and relies heavily on the graphics card. The result was a three-way tie between the 5900X, 5800X and the i9-10900K.
Gaming Overall
Having tested the Ryzen 7 5800X, the Ryzen 9 5900X and as a daily user of the i9-10900K, I’m confident that with a GTX 1080 Ti GPU or better, most (if not all) people won’t be able to tell the difference between these three CPUs in gaming without the FPS being displayed on the screen. The benchmarks show a subtle edge to the 5900X but in real-world gaming experience, this would be very hard to detect.
I also played COD: Modern Warfare, Battlefield V, a little bit of Fortnite, and Red Dead Redemption II. I switched between the 5900X test bench and the i9-10900K test system (also switching the 2080 Ti) four times over a month and in my experience both platforms felt the same.
Given that the Ryzen 9 5900X is slightly cheaper and has two more cores for better creative workload performance I’d have to lean towards the 5900X in a head-to-head contest between the two options. I should note, however, that the Intel i9-10900K has an ‘availability’ advantage at the time of writing with both the 5800X and 5900X either sold out or on pre-order in most Australian stores.
Thermals and Power
AMD stated that the power delivery limits for the socket remained the same and that the extra performance was not being achieved with more power draw.
My advice to anyone looking for a thermal solution for the 5900X would be to go with an above-average cooler like a 140mm tower cooler or a 240mm AIO water cooler from a reputable manufacturer. My personal preference when air cooling at the high-end is the Noctua NH-H15S cooler due to the asymmetrical design, thermal performance and whisper-quiet acoustic profile.
This recommendation isn’t because the CPUs run not but rather if you are going to spend that sort of money on a CPU, give it the best opportunity to run and run quietly.
Thermal Performance
Let me preface this by highlighting that the test bench is an open-air case that doesn’t have any active airflow across the board.
Thermals were fine – when using a 240mm AIO water cooler on a standard profile, the fans remained quiet unless doing an extreme task like a Blender run. Temperatures were similar to the Ryzen 7 5800X and previous Ryzen 7 3800XT. Note that I was testing the 5800X immediately prior to this CPU. Both the 5800X and 5900X appeared to perform about the same from a thermal perspective.
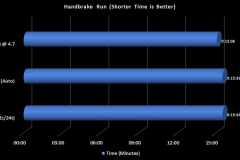
Typical thermal performance during gaming topped out at 68-71C in our testing which is pretty standard. The workloads for gaming on a processor like this are highly variable so we see regular dips and peaks in usage percentages which allow the temperature to recover and we see lower maximum temperatures when compared to the more consistent and sustained workloads from rendering or transcoding. The Handbrake and Blender tests saw a peak of 79C but lower averages in the mid-70s. Idle temperatures were in the 30s when testing in a room that had an ambient temperature of 22C.
I was expecting this level of performance to come at a thermal penalty so it was a pleasant surprise to see that it didn’t.
Power Draw
Power draw was very reasonable with an idle reading of 90-110W total system draw. When gaming in COD: Modern Warfare with the RTX 2080 Ti going at full tilt the power draw was typically 430W for the entire system. Rendering and transcoding workloads that didn’t use the GPU saw the test bench pull a typical 235W from the wall. The 5900X is certainly efficient when we look at power draw and benchmark scores.
Overclocking
Overclocking is ‘bonus’ performance and will vary between individual CPUs of the same specification. Please remember that overclocking a CPU can damage it and any overclocking you do is undertaken at your own risk.
Out of respect to the other processors in the line-up, all CPUs used for comparison can be overclocked for better performance subject to power delivery, silicon quality cooling and other environmental factors. This testing is to show what we could achieve with a basic overclock that the average enthusiast could expect using off the shelf cooling and components. No custom cooling or heavily involved overclocking operations here.
I tested the Ryzen Master “Auto-overclock” with a +200MHz on the boost clock and then separately with a manual all-core 4.7GHz overclock at 1.4V. I also overclocked the memory from the XMP 2933MHz to 3200MHz for both tests.
The Auto overclock gave the single-core or lightly threaded workloads an extra bump to 5150MHz on the active core without a notable thermal increase in gaming. When transcoding, I noted that the peak temperatures increased by 5 degrees to 84C, however, the averages only increased by 2-3C on average. This overclocking method delivered a marginal improvement in Single threaded Cinebench R20 and SuperPi benchmarks but was not beneficial in games. The multi-core performance was no better in tasks like Blender or Handbrake.
An all-core overclock where all 12 cores were locked to 4700 MHz sacrificed top-end boost clocks and single-threaded tasks like gaming but bypassed the Precision Boost 2 algorithm to run all cores at a higher frequency for multi-threaded tasks. Operations like Handbrake, Blender and the Cinebench R20 multi-core benchmark all performed better with this overclock in place. Games tended to perform the same or slightly worse with an all-core overclock.
I’d be inclined to just let Precision Boost 2 do its thing and leave the processor to run with any Multi-Core Enhancement BIOS options enabled. The option to tinker is there if you want it – AMD unlock their Ryzen CPUs so you can overclock at your own risk.
Pricing
The street price is currently (AUD):
- 5950X: $1249
- 5900X: $859
- 5800X: $699
- 5600X: $469
For context, the 3800XT currently has a street price of $659, the i9-10900K is $899. If you can find one in stock, the second-generation Ryzen 7 CPUs are available for $349.
$869 for the Ryzen 9 5900X is a good deal when compared to the i9-10900K given that the 5900X performs better overall and is cheaper. For people on B450 platforms and above looking at upgrading their Ryzen 2nd Generation CPU, it’s a no-brainer to go with Zen 3 – the question just becomes “which one to choose?”.
There’s just one little problem… availability.
The main factor that complicates things is availability. At the time of writing, most e-tailers seem to have sold out of Zen 3 CPUs and the majority of stores don’t have an ETA for new stock. With that in mind, people who legitimately ‘need’ a new PC and can’t wait might be willing to drop the extra $40 and go with the Intel i9-10900K.
Final Thoughts
Zen 3 is the ideal upgrade for anyone on a first or second-generation Ryzen CPU. As long as you can verify that your motherboard BIOS can support an AMD 5000 series CPU, it becomes a very cost-effective upgrade and it’s quick without requiring a reinstall of Windows.
When testing the Ryzen 7 5800X, I could see myself upgrading to it from my Ryzen 2700X early next year. As a gamer, the 5800X is ideal – it’s quick and has 8 cores so it is handy for multitasking and transcoding. More recently, I’ve also been needing to run multiple Virtual Machines and execute some moderate-level creative workloads – at the moment I use a second PC for those tasks.
During testing, I found that the Ryzen 9 5900X would allow me to replace both PCs with a single workstation, consolidating my storage and claiming back some valuable desk space. My needs don’t justify the 16 cores (or the price tag) of a 5950X and I’m not sure how long before I’d outgrow the 8 cores of the 5800X or the 10 cores of an i9-10900K. As Goldilocks would say, the 12-core Ryzen 9 5900X would be “just right” in my scenario.
If you don’t need 12 cores, I’d recommend saving ~$120-150 and buy the Ryzen 7 5800X. For creators and gamers that need a CPU for streaming, content creation or to run VMs in the background, find a way to stretch for the 5900X.
At $859, the price is right – hopefully, the supply improves to meet demand because the Ryzen 9 5900X is one of the best CPUs to buy at the moment.
| AMD RYZEN 9 5900X | |
|
PROS |
|
| CONS | – Availability of stock |
| Awards |  |
Full disclosure
AMD loaned the Ryzen 9 5900X and Gigabyte X570 Aorus Master to PCTechReviews for testing. I have not received any incentive from AMD nor any other entity for this (or any other) review.
ASUS also provided other supporting components for this review on a loan basis and to assist in the creation of other future content.

